

Interviewing Dr. Ryan Weightman on Epidemiology
Dr. Ryan Weightman is a postdoctoral presidential scholar and researcher at Rutgers University. He uses mathematical models to understand complex phenomena like public health. In this interview we touched upon his recent work optimizing epidemiological models and his advice for high school researchers!
EPIDEMIOLOGYBEGINNER FRIENDLYINTERVIEW
Sohum Bhardwaj
5/26/20266 min read
Intro
How close to the real world can we get, using math?
This month, I interviewed Dr. Ryan Weightman, a presidential postdoctoral fellow at Rutgers University. His work concerns this very premise. Personally, I found Dr. Weightman to be such an approachable and enthusiastic person. His passion for his work was clear in every response and it was super fun talking with him.
During the Covid-19 pandemic, he investigated how non-pharmaceutical interventions (quarantines, lockdowns, contact tracing, closing public transit, etc.) could be used to buy crucial time needed to develop hospital infrastructure. In fact, his estimates ended up being sent to former NJ Governor Murphy and President Trump.
In general, his research focuses on using mathematical models to generate predictions about a variety of situations, whether it be vaccination, public transit, or lockdowns.
Today, we will dive into the challenges associated with pandemic modeling and Dr. Weightman’s research into optimizing current models. This topic illuminates a completely different side of math. It involves quantifying the quantitative or using math as a language to rewrite problems in a different lens.
Sensitivity and Mathematical Models
Instead, researchers use the information that is available to make a guess. Dr. Weightman explains, “I can make a really good estimate given the previous rate of change, how many people are sick at a certain day in the past…two weeks ago or three weeks ago, given data that we have”
This is one of the key understandings I came away with. Parameters, or the inputs to these models, are extremely important. Good estimations of initial parameters lead to great predictions and bad estimations lead to innacurate predictions. For this reason, Dr Weightman explained, it is critical that models are not too sensitive to any given parameter.
For example, the triple pendulum is hypersensitive to its initial position. If we simulate two triple pendulums, in slightly different positions, they end up diverging spectacularly after a short while. This is a huge problem for an epidemiological model where the best we can do is estimates. Ideally, we want estimates to produce a similar result to the actual scenario, which means we do not want our model to be super sensitive like the triple pendulum.
How do researchers deal with sensitive parameters? Dr. Weightman explained that there are a variety of scenarios. First, “if [the] parameter is not that important to your system, but it's making big changes in your model, you have a red flag…something weird is happening. [I would] figure out how to reformulate this model without that parameter.”
On the other hand, “If the parameter is really important to your system, you might just have a sensitive system. So sometimes you can't get around having a really sensitive model. But a lot of the time you can reformulate your equations”
Another challenge arises when you find multiple parameters that are correlated with one another. In this case, Dr. Weightman explains, “You know either to remove one of those parameters or reformulate them into one group of parameters.” The example that he brought up was the counties with the most HPV-related cancers in New Jersey and the poorest counties, “The correlation is almost one to one. It's really a depressing fact. But what that means is those two things really, really correlate. And so if you're using them both in a model, you might be double counting”
You might notice a pattern emerging. In fact, Dr. Weightman himself remarked, “The answer is usually reformulating and thinking about things.”
Another concept that sticks out is how parameters and factors are not isolated. They are related to each other, and these relationships have major implications for mathematical modeling. In the case of related parameters, they can multiply and influence the model, and in other cases, as we will soon dive into, they can reduce each other's effects.
A mathematical model is a way of representing real world phenomena in terms of equations. If the math equations we write are accurate, we can manipulate them and observe how their values evolve over time to forecast future vents.
The tradeoff is that mathematical models are simplifications. Creating an equation that is perfectly accurate is not only impossible, but it defeats the key advantage of using mathematical models, which is their ability to transform abstract concepts into quantifiable values.
The first challenge with creating a model for a disease outbreak is that we don't know the number of infected people. As Dr. Weightman puts it, “I have zero idea how many people currently have the flu.” This surprised me since one of the most famous models in epidemiological research is the SEIR model, and a huge part of that model is knowing the initial populations of infected, susceptible, exposed, and recovered individuals.
If you aren’t familiar with SEIR models, check out this post which covers them more in depth.
Improving the SEIR Model
One inconsistency present in hastily made models is the issue of overlapping interventions. When multiple interventions affect the same population, for example a general lockdown and a lockdown of the elderly, sometimes models may double count the reduction in interactions.
While it is easy to understand where these overlaps come from, Dr. Weightman explains “It's still a really interesting question of how you implement multiple interventions that have a clear overlap.” One of the sections of Dr. Weightman’s paper, which he wrote in collaboration with Dr. Gabriel Benedetti, was about overlapping interventions. Specifically, how public transit control and general lockdowns affect more specialized options like senior lockdowns and school lockdowns.
Dr. Weightman said, “we…implemented a few that we knew there was an overlap [and] we could get data and…estimate the overlap and then work through what math happens when there's the overlap. And it turns out the math makes the models really complicated”
The reason why complexity is so undesired is due to overfitting. Since many more parameters and terms are added through each overlapping intervention, eventually the model gets so complex that it can fit to data due to the sheer number of variables, which harms its ability to generalize to unseen data.
Another optimization Weightman’s team made to the model was considering linear and quadratic effects.
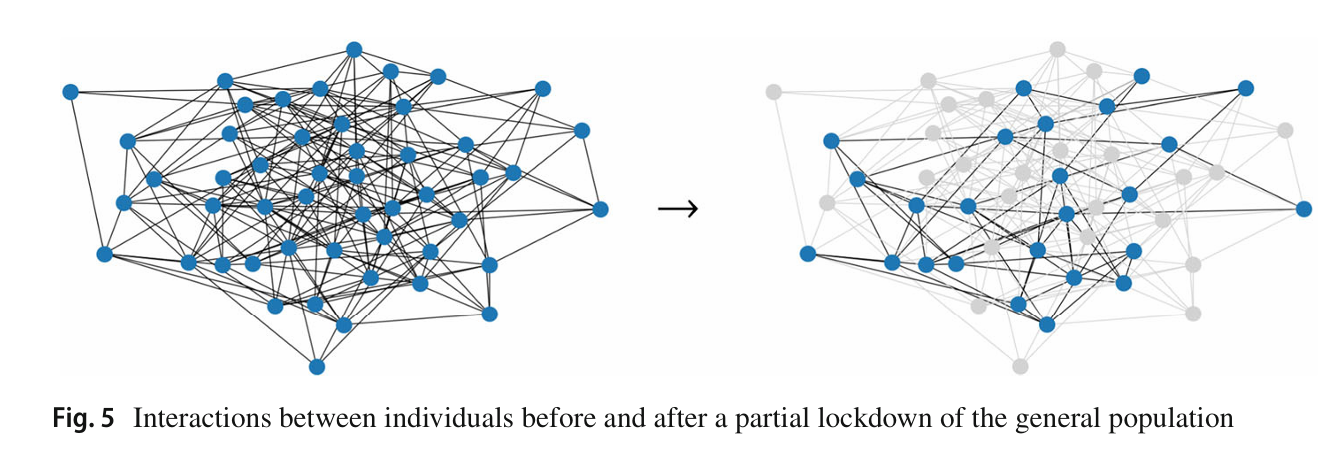
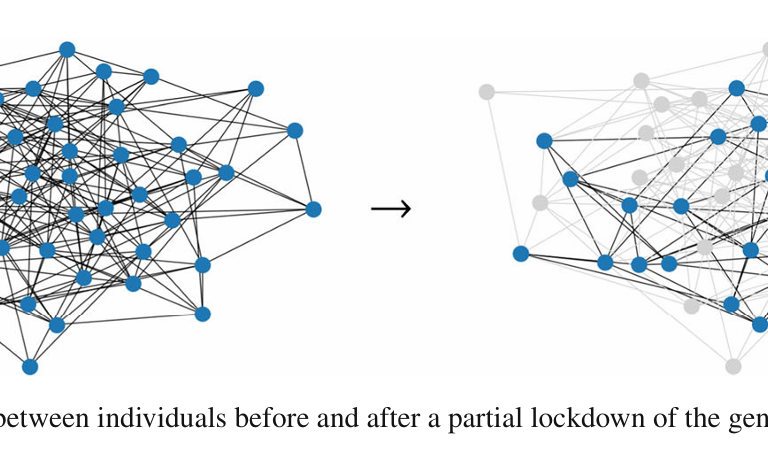
When you halve the number of open schools, as you would expect, you’d halve the amount of interactions happening within schools. However, if you made 50% of the people in each school stay home, you’d reduce the interactions by around 75%, a quadratic effect. This is because when you halve the amount of people within a school, each person left has fewer people they can interact with. It is illustrated in the image above.
The researchers simulated what optimal intervention strategies would look like when accounting for these effects.
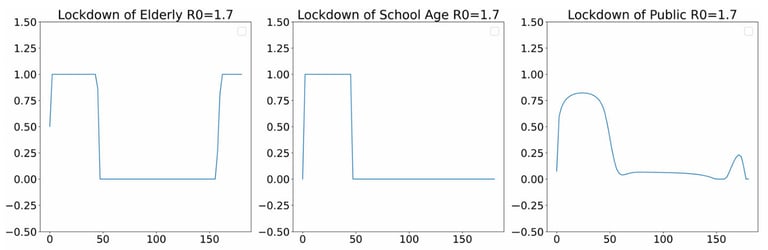
The graph above illustrates that, when overlapping costs and quadratic interventions are used, the model saves resources and strategizes differently. Despite this, it is important to take the exact numbers with a grain of salt. Dr. Weightman clarified, “It's still more of a theory paper where the goal was to talk about the interventions. And so, the fact that the cost was lower was enough to prove the hypothesis that you get the quadratic relationship and the quadratic relationship's beneficial.”
These optimizations reflect how researchers build upon previous work. As Dr. Weightman says, “if you understand the system, you can change the system in really small ways for the better.” His work illustrates the power of leveraging these small changes to save lives and resources.
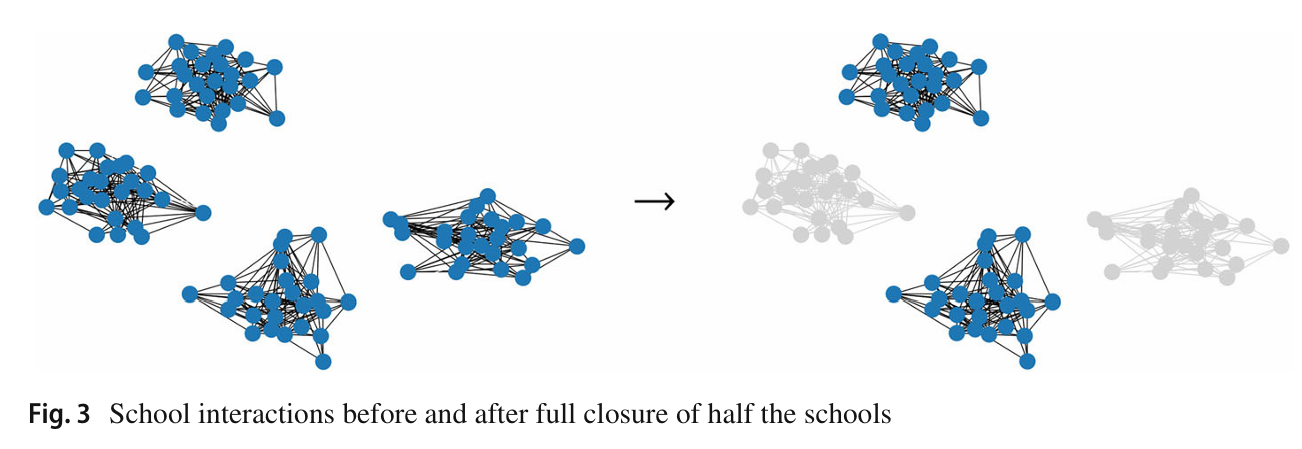
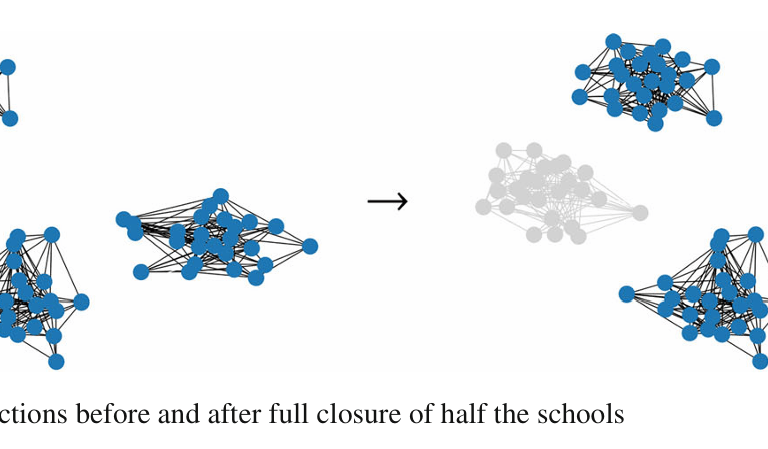
Each cluster of nodes represents a school, by removing clusters (equivalent to closing schools) we reduce the amount of connections linearly (Image Source)
By having 50% students go remote, reduce the connections by much more than 50% (Image Source)
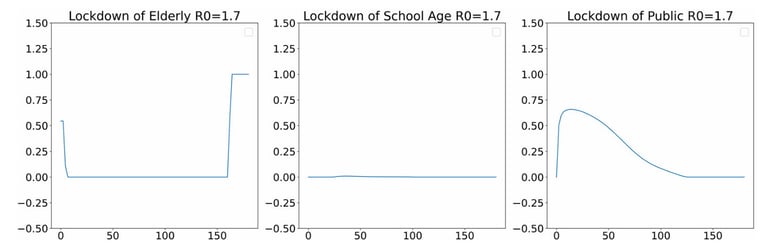
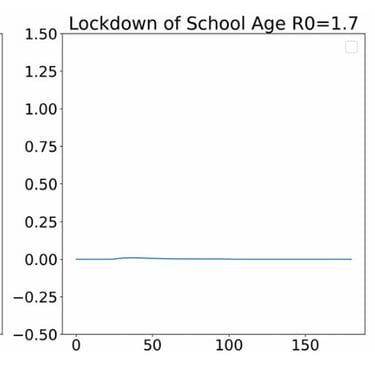
Optimal utilization of the interventions without taking overlapping costs into account. R0 is a parameter that corresponds to the amount of people each infected person is expected to infect. Y-axis is the percent of the population that is affected by each intervention. (Image Source)
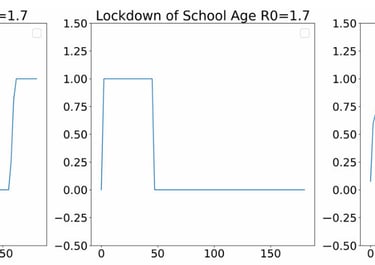
Optimal Usage of interventions when taking overlapping costs into account (Image Source)
Conclusion
Lastly, Dr. Weightman gave his advice for high school students looking to get into research. He recommended learning to program in C++ since it is great for learning in general. He also recommended R and Python as they are commonly used in science.
Dr. Weightman also said, “[the] hardest part of research is reading a paper, not understanding anything in the paper…grit is really important” which really resonated with me. So many of the papers I’ve read as a highschooler looked like complete gibberish at first. In my experience, deciphering papers is something that you get better at through practice.
Regarding imposter syndrome in research, Dr. Weightman said, “There's comfort in knowing that everyone feels that way. There's comfort in knowing that you'll interact with people who know more than you, of course, but you'll never interact with someone who actually knows as much as you think they're going to know.”
Currently, Dr. Weightman’s work focuses on modeling crowd behavior. In his own words, “there are all these cultural aspects of how people move. and no one's really quantified them.” His website is linked here, if you’d like to contact him!