
Computation and Covid: Disease Modeling Techniques
Epidemiologists, scientists who study epidemics, launched into action when the Covid-19 pandemic began. Armed with an array of disease prediction models, they took upon the task of understand the new infection. Their actions would inform governmental policy that would save millions of lives.
BEGINNER FRIENDLYSTATISTICSEPIDEMIOLOGY
Sohum Bhardwaj
1/1/20256 min read
During the Covid-19 pandemic, you were probably like me: sitting in your house with way too much free time on your hands.
Yet millions of lives were held in the decisions of policy makers that needed to weigh competing interests. Which hospital to supply? Should we enforce social distancing? How stringent should we be? Lockdowns? The world hadn’t seen a pandemic at this scale in over a decade.
The field of epidemiology, study of epidemics, now had access to data on a global scale. Scientists utilized this stream of precious real-time data in order to make algorithms that would assist in crucial policy decisions. Unironically, the field entered a period of rapid advancement due to the increase in funding and interdisciplinary collaboration due to the pandemic.
During this post I will explore the tools and methodologies used by scientists around the world to fight Covid and then consider some of the future challenges that experts have outlined.
This blog post
1 Intro
2 Early Successes
i. Estimating R0 in Wuhan
ii. Development of Transmission models
3 Modeling Techniques
i. Plague Inc. and SIR
ii. Agent and Network Based Modeling
4 Modeling During the Pandemic
5 The Future of the Field
Early Successes
Quickly after the virus broke out in Wuhan, several scientists looked at the data to make a rough calculation of the reproductive number (R0). The R0 specifies how many people the average infected will spread the virus to.
They used a simple model, called a branching process model, and fitted the infections in Wuhan to the model. While this sounds complicated–it's not. They tried several values for the variables of the model until they found a set that made the model roughly resemble the data.
They estimated it to be 1.5 - 3.5 which rang alarm bells to many epidemiologists' ears.
A R0 < 1 signals the disease will soon fizzle out while a R0 > 1 signals that the disease will spread into an outbreak. (Of course, that is in theory–in reality this is not always the case)
Estimating R0 in Wuhan
Development of Transmission Models
Once data collection was established, transmission models were developed to provide insight into how the virus was spreading and estimate changes in the R0 from policies like social distancing.
Transmission models try to predict how the disease will spread given information like the current infected population and age demographics.
One of their uses was to estimate the impact of non-pharmaceutical interventions or NPIs. NPIs are methods of containing the disease without using traditional methods like medicine or vaccines. These include social distancing, lockdown, and contact tracing–all the favorites.
Modeling Techniques
Now let’s explore some modeling techniques that incorporate epidemiological insights at their core. These models are transmission models and they try to provide insights into the R0 among other factors.
Plague Inc. and SIR
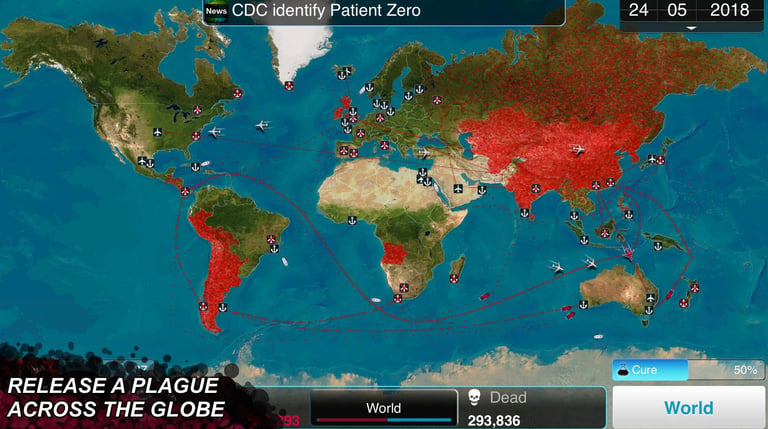
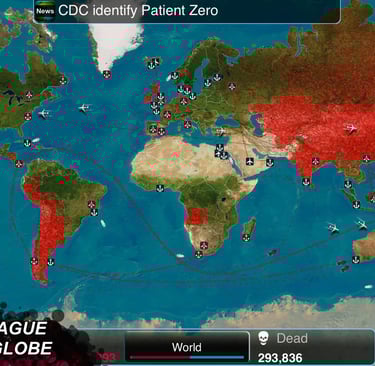
In February of 2020, as the Covid-19 pandemic reached the global stage and Ndemic’s Plague Inc. reached the top of the iOS app store as the top paid app after dominating sales in China.
In the game, the player will act as a virus and try to infect and kill the entire world population before a disease is developed. If you are confused why people would want to play this during a global pandemic—you're not alone. Nevertheless, the game has been praised for its intricate mechanics as it takes into account travel routes as well as a variety of environmental factors in calculating the spread of the disease.
Facing the surge in sales, Ndemic scrambled to state that the systems used in Plague Inc. are not even close to as accurate as the models developed by experts and referred players to the World Health Organization’s website instead. Despite this, the model used by the 2012 game is still fascinating as it was based on the popular SIR model.
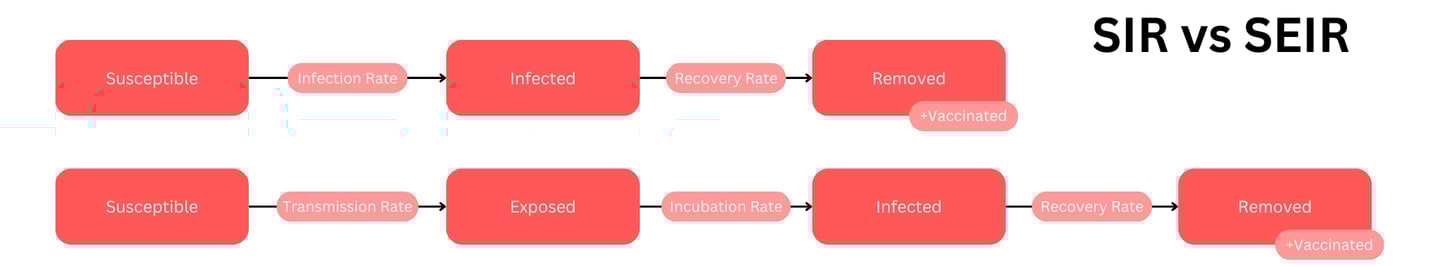
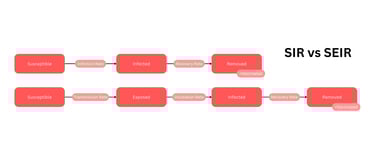
Ok, enough backstory, what is the SIR model? It stands for susceptible-infected-removed.
Susceptible refers to the population of unvaccinated non-infected people
Infected refers to the population that has been, well, infected
Removed includes vaccinated and people who have recovered and are not susceptible due to the immunity gained from being infected.
An infection rate and recovery rate is usually determined from analyzing data. These rates control the increase and decrease of these populations (lots of calculus that I won’t get into here). The model allows a researcher to roughly predict what will happen when a static population of susceptible individuals is exposed to a pathogen. You can work with your own SIR model here: SIR modeling tool.
Usually, researchers include E for exposure and another constant: the incubation rate which is how long it takes for the disease to infect the body once it has entered. This would make the model SEIR.
An SEIR is said to model the population more accurately but both models are simple and inaccurate for long-term predictions. Their interpretability and ease of use is what makes them popular.
Agent and Network Based Models
These epidemiological models are a tad more complicated than SEIR, but more powerful.
Agent based methods model each “agent” or person and simulate their interactions. This simple technique allows the incorporation of complex social behaviors through bottom up techniques. Each agent is intended to act as a real person with their own tendencies and social networks.
In practice agent-based modeling is complicated and computationally expensive when used to model social dynamics, so network based methods are used as a compromise.
In these models, the “network” is a graph with nodes representing people and edges representing interactions. Different weights can be placed on each edge to represent the likelihood of the disease spreading between individuals.
Both Agent and Network based models oftentimes use the SEIR framework for modeling the various states of the people within the population.
I’m sure you have noticed the fundamental tradeoff between all of these models. The closer we try to get to the real world, the more computationally costs and complexity we encounter! This is a fundamental truth not only in epidemiological modeling, but modeling of any real world phenomenon.
More complex models also have to be trained longer.
This involves finding the value of several parameters. These parameters are generally constants in mathematical functions that need to be tuned by fitting the model to the data. A simple SIR model has only 2 parameters, the infection rate and recovery rate. However, more complex models can have hundreds.
A variety of complex techniques can be used to tune the parameters of a model which are way out of the scope of this post.
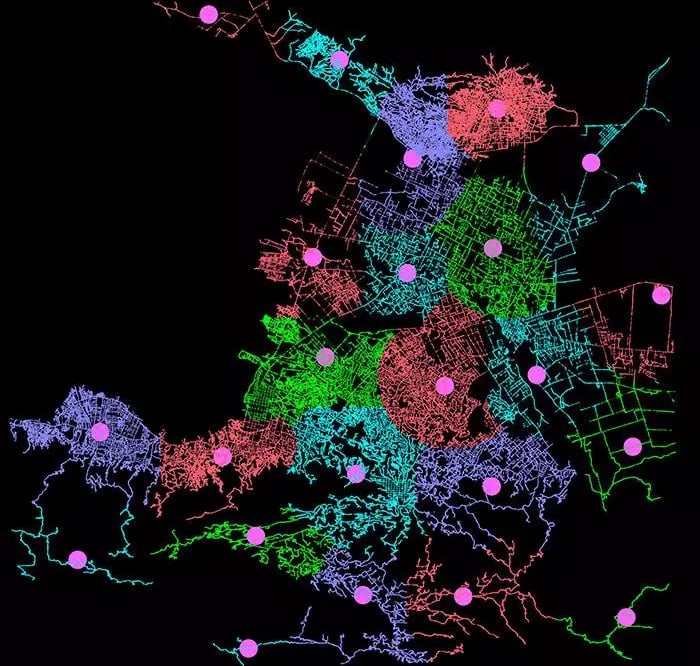
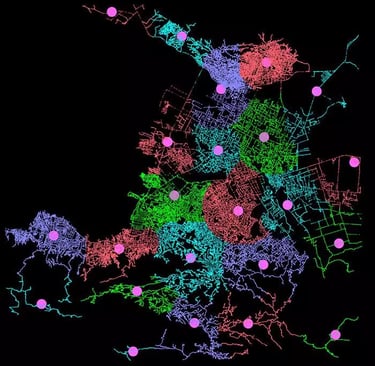
An image of a hybrid network and agent-based model. This image shows the sheer size of such models. Source
Modeling During the Pandemic
Okay, so now that we have established how several common modeling techniques work. What can we actually do with these techniques?
As mentioned previously, models constructed from these techniques are used to inform policy makers on healthcare demand. These short-term predictions are particularly useful because oftentimes the effect of an outbreak or a certain intervention is delayed.
For example, when there is a viral outbreak, it may take days for an infection to take root and longer for symptoms to show. Therefore, these models offer more situational awareness to policymakers which helps them make better decisions.
In the UK, models monitoring the emergence of the delta variant of Covid prompted the government to delay the final step of its lockdown plan by a month.
Other models estimated the effect of various factors on R0 rates. For example, one study used data about the transmission rates for several age groups to determine that reopening schools would lead to a 26% increase in covid-19 transmission.
Another study used a hybrid network and agent-based model to find the digital contact tracing is a viable NPI. The model was able to recreate data observed from the first wave of Covid in England.
These models informed decisions on NPIs, hospital resource allocation, and saved countless lives.
The Future of the Field
One review article published in Orion journals highlights the role of machine learning and AI as tools to capture complex epidemiological patterns. Neural networks have already found considerable success in this regard.
They attribute the recent advancements of the field to growing awareness of the importance of predictive models to public health as well as the rise in interdisciplinary collaboration in epidemiology.
At any rate, the increase in technology and vast amounts of data leftover from the pandemic will allow researchers to have a massive pool of data to work from.
Undoubtedly, our response will be faster and more accurate in the future thanks to the development of these disease predicting models!
SOURCES
Review that goes over several algorithms being used in the field (including deep learning methods) and also discusses the field as a whole: Data analytics for predicting disease outbreaks: A review of models and tools
Hybrid ABM and Network based model that estimated the effectiveness of digital contact tracing: OpenABM
COVID-19 Outbreak Prediction with Machine Learning
Very useful chapter from a book detailing the types of models used during the pandemic: 25 Models in the COVID-19 Pandemic | SpringerLink
Age groups that sustain resurging COVID-19 epidemics in the United States | Science