Drug Prediction: Starring Graph Attention Networks
Drug prediction is one of the most important tasks in all of computational biology. Being able to predict whether a drug will be effective can allow for huge strides in personalized medicine and save millions in costs for clinical trials. There is just one problem: it's really hard. To add on to the difficulty, being able to predict drug efficacy isn't enough! Models should also be able to provide insight and interpretability into their reasoning. This post will explore how models stive for interpretability and accuracy in the complex task of drug prediction.
GENOMICSEXPLAINERMACHINE LEARNING
Intro
Drug prediction is one of the most important problems in medicine, it holds the potential to save billions in clinical trial costs and push personalized medicine from ideal to reality, and it all boils down to a single question:
Given a drug, will it be effective on a patient or not?
It sounds simple, maybe you may debate what "effective" means, but most machine learning models simplify it to a binary choice based on an established benchmark. 0 = doesn't meet the benchmark, 1 = meets/exceeds the benchmark. That means you have a 50% chance to get the answer right on average guessing. Look at you, halfway to changing the world already!
Yet, it wouldn't be such a rewarding problem if it was easy--would it? Even a 10-30% increase in those chances, is incredibly difficult to achieve due to the ridiculous complexity of biological systems.
To illustrate this, consider what we can already do:
We can take a cell, and measure how prevalent each gene is, or how expressed it is. This information gives us insight into which proteins are floating around in the cell at the given moment--the same proteins that our drug is going to interact with. It also tells us information about the unique regulatory and metabolic patterns of the organism that the cell comes from.
Given this powerful information, basically a snapshot of the cell, and our vast knowledge of genes and proteins. You'd think that predicting how a drug would behave would be a piece of cake. Well, it would be if we were a version of Laplace's demon, able to simulate every molecular interaction, but we are not.
So, we do the next best thing, try to simplify this highly complex system into something we can understand. That is where neural networks come in, they can distill the most essential aspects of the data we feed them and find patterns in it. Then, like magic, they use these hidden patterns to make predictions on something immensely more complex.
However, prediction is only half the challenge. The other half is interpretability.
In other prediction tasks, like with LLMs, models often sacrifice interpretability for accuracy (despite the pleads of AI ethics researchers--but that is a topic for another blog post).
In drug screening, interpretability is not optional. Researchers need to verify mechanisms. Clinicians need trust and transparency. Regulators need justifications. And sometimes, we’re even willing to sacrifice accuracy, if it means we can open the black box and understand what's happening inside.
This is the topic we will be exploring in this month's post: how we build interpretability and accuracy into cutting edge models, so I hope you're as excited as me!

Graph Attention Networks
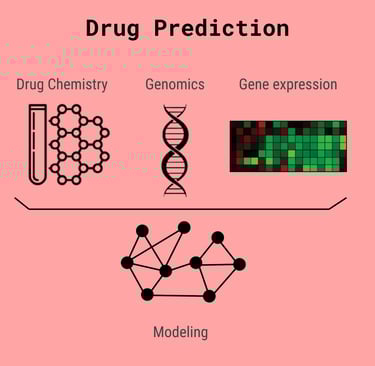
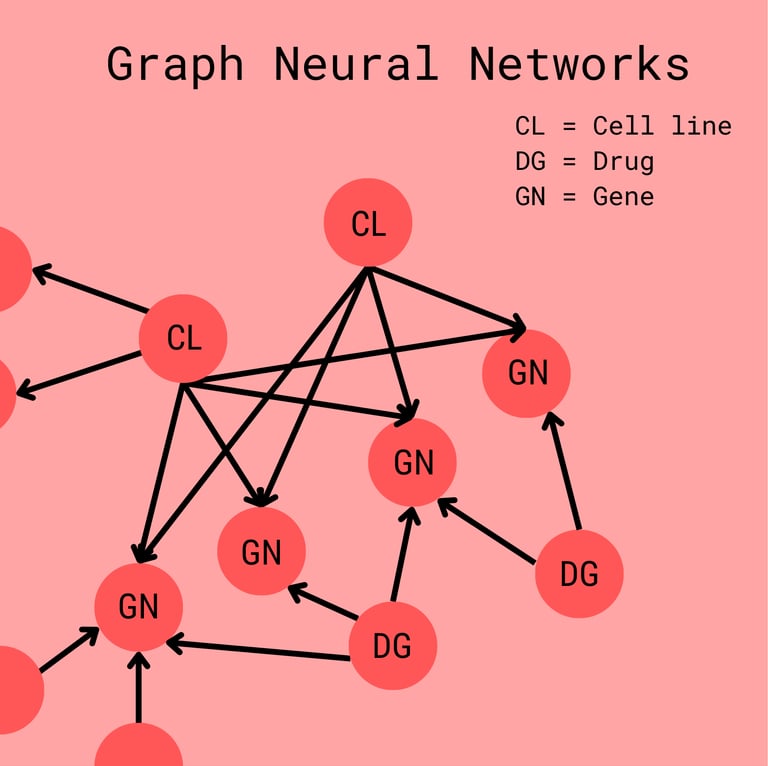
Before we talk discuss embeddings further, it is important that we discuss the structure of the neural network itself. You see, we have to combine many different types of data: knowledge about genes and their products, profiles of the gene expression, and the chemistry of the actual drug. We commonly organize this using a graph.
Each node represents a drug, gene, or cell line. They all contain a vector that represents the information about the gene/drug/cell line but has been standardized so that nodes can easily be compared. The edges have intuitive biological meanings as well.
Here standardized means they have been transformed by a matrix into a vector embedding of a fixed size, each type: drug, cell line, gene has its own transformation factor, but the end product vector is of the same size. This makes it easy to perform mathematical operations despite the different types of information represented by each node.
A Drug -> Gene edge (usually a directed edge) may represent how a drug may interfere with a gene's product
A Gene - Gene edge may represent how the protein products of either gene interact
A Cell line -> Gene edge may represent how expressed the gene is in the cell
Cell line - Drug edges are usually omitted as they are used for the prediction in the end.
Now we have a basic understanding of the structure of this "graph", you may be wondering what the neural network actually does. How does it operate on a dynamic data type like a graph, whose size and structure are variable. If we consider other types of models, like those that take in text or images, the structure is pretty simple. Images can be downscaled or upscaled to a fixed size, and text is linear in nature. Graphs are messy, like biology.
For this section, my aim is not to delve into the mathematical frameworks that underlie these models, but to offer a general understanding and intuition that is easy to grasp.
As was made painfully clear in the introduction, biological data is complex. Though, one of its most awe-inspiring properties is that it can be represented in a much lower dimensional space than what it is presented in.
Let me break down what that means.
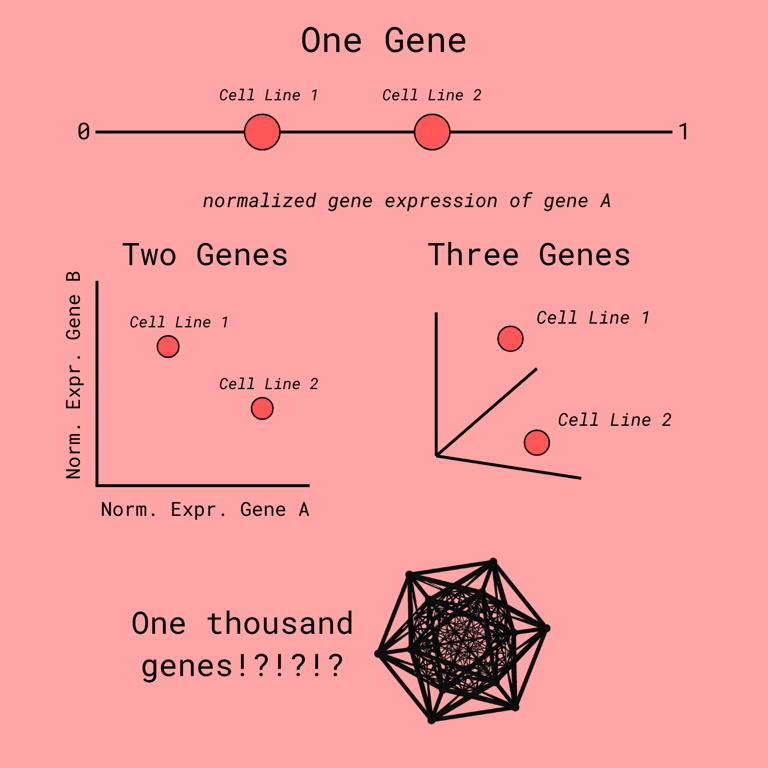
For drug prediction, we track the expression levels of thousands of genes. Each gene can be thought of as another dimension to the data. For example, for two genes, we could place one the X-axis and one on the Y-axis. That is 2 dimensions. Each additional gene adds another dimension. So, thousands of genes correlate to thousands of dimensions.
That is not just hard for you to visualize, it's also hard for computers to work with. Luckily, it is a general rule that we do not need all these dimensions. The essential variance, the differences that matter, can be captures with many less dimensions.
If this discussion has piqued you interest, you may want to read more about how bioinformaticians cleanse and reduce the complexity of biological data, then you should check out this post on single cell sequencing.
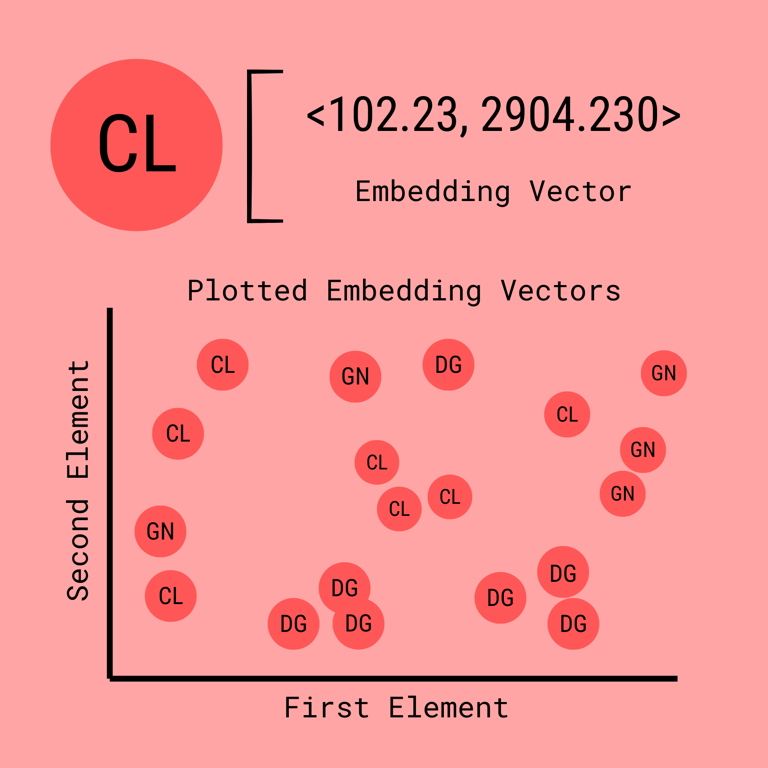
Now, when neural networks approach this problem, they do something clever: they compress large gene expression profiles into concise embeddings--compact vectors that distill the essential features of the input. These embeddings are then used to compare drugs and cell lines, helping the model make predictions.
The Structure of GNNs
The Black Box
The key insight is message passing, here is a video that goes into depth. The idea is that each neighbor of a node, or the nodes that it has an edge with, will have their vector values combined or aggregated by a mathematical function. The result is a new vector that helps explain the node in context of its neighbors. It is what we call an embedding.
You can think of embeddings like coordinates in a weird, high-dimensional space. For example, two drugs placed close together in embedding space likely have similar properties; two cell lines mapped far apart are likely very different.
Importantly, these embeddings don't represent variables like “toxicity” or “gene A expression” since the axes themselves are abstract. Instead, they reflect the differences that the model has learned to pay attention to.
And this is where the black box problem arises.
After message passing, several rounds of it, we have developed seemingly random embeddings for all the nodes in our graph. The model then compares these embeddings to make prediction. As a clinician or researcher, I don't really know how the model came up with the prediction. I can look at the embeddings it compared, but they are esoteric, only understood by the model itself.
Key questions are unanswered:
what biological connections did the model leverage?
what proteins or genes did it focus on?
is it even considering the right things?
These questions matter a lot when dealing with the decision to develop a drug or whether to prescribe an existing one to a patient. If you were a clinician and a black box told you that the drug, one you gave to five similar patients, won't work on this new patient, you would want a damn good reason why!
To recap, the black box refers to how there is little way to understand how a model reasons about its decisions due to the ambiguity of embeddings. On one hand, they are powerful for comparing and finding similarities in highly heterogenous and complex data, but they are also cryptic and unintelligible to humans.
Introducing... Attention!
Attention is a key mechanism we add to graph neural networks (GNNs) to reintroduce interpretability. This makes it an extremely powerful feature!
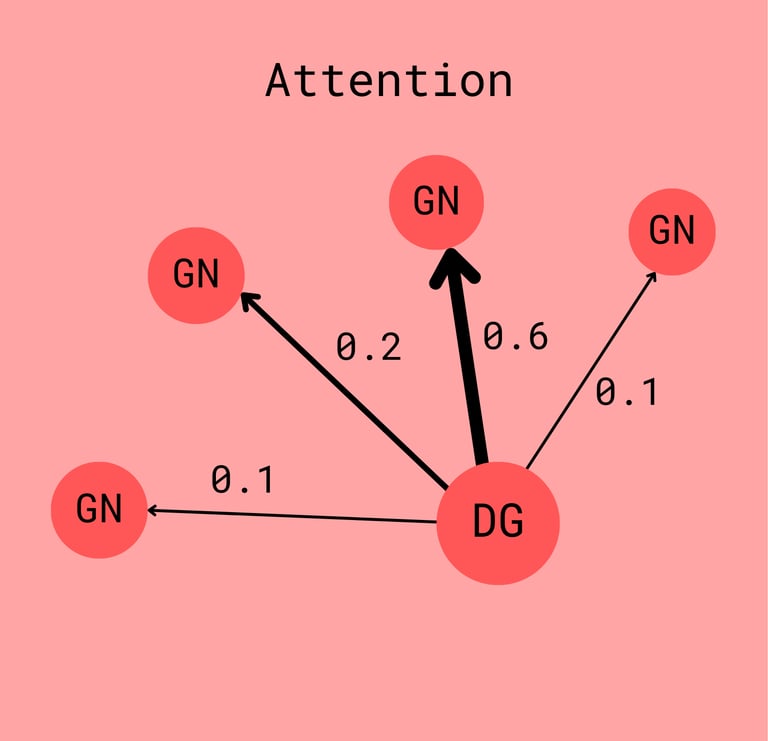
In attention-based GNNs, attention values are assigned to edges. These values are typically normalized (via softmax) so that they sum to 1 for each node's neighborhood. During message passing, these attention weights determine how much influence each neighbor has on the updated representation (embedding) of a node.
This is powerful because attention values are learned. The model adapts them during training to prioritize biologically meaningful relationships. For example, if a drug node is connected to many genes, the model might assign higher attention to the ones more relevant to the drug’s mechanism of action.
This not only improves predictive performance but also gives us a window into the model’s reasoning. By inspecting the learned attention weights, we can infer which connections it deemed most important — sometimes even revealing previously unknown or underexplored biological interactions.
If you're curious about the math: the attention score between two nodes i and j is computed by first combining their feature vectors (typically via concatenation), then multiplying by a learned vector A, and finally passing the result through a nonlinear activation function like Leaky ReLU or Sigmoid.
Don’t worry if that sounds abstract, the takeaway is simple:
Attention is a learned mechanism that provides insight into which nodes had the most impact on the resulting embedding.
To illustrate how attention improves both accuracy and interpretability, I'll now spotlight a landmark paper in drug prediction that successfully leverages Graph Attention Networks to address the "black box" problem in deep learning models.

Spotlight: drGAT
drGAT, I want to say its short for "drug response prediction Graph Attention Network", but in my head I will always pronounce it as Doctor Gat ;)
Anyways, drGAT is revolutionary because it introduced attention into the drug prediction scene, bringing more interpretability and accuracy. Doing such a thing required completely changing the structure of the graph altogether. Not an easy feat.
Let's start with predecessors, other models like SRMF, HNMDRP, or MOFGCN used low-dimensional embeddings to completely abstract away the genes from the gene expression profiles. I know I talked about genes, cell lines, and drugs being nodes, but before drGAT it would be just drugs and cell lines.
As a result of the genes being abstracted away, it was impossible to tell which genes specifically influenced predictions. It was like mixing a ton of spices together into a blend, you can't tell which ones are responsible for the flavor anymore.
drGAT was revolutionary by separating the genes from the cell lines. The gene expression data was associated with the individual genes and encoded by the connections between genes and cell line nodes. This allowed them to introduce attention values between drugs and genes to highlight the most influential genes for drug predictions.
In doing so, it harnessed the power of Graph Neural Networks without losing the biological insights. Instead of demanding that clinicians just trust the math, it provided a reason for specific predictions.
One interesting note is that this led to a more robust verification process for the model where the researchers compared the model's insight to existing biological research, proving that the attention feature really did highlight biologically relevant pathways.